Since the start of April and the beginning of Q1 2020, there has been a lot of debate about Bitcoin following Golds‘ characteristics and its market. On the other hand, some speculation and reports suggest that Bitcoin is still strongly correlated to the traditional stock market.
In order to attain better clarity, we analyzed some of the data and charts exhibited by skew over the month of April.
Source: Skew
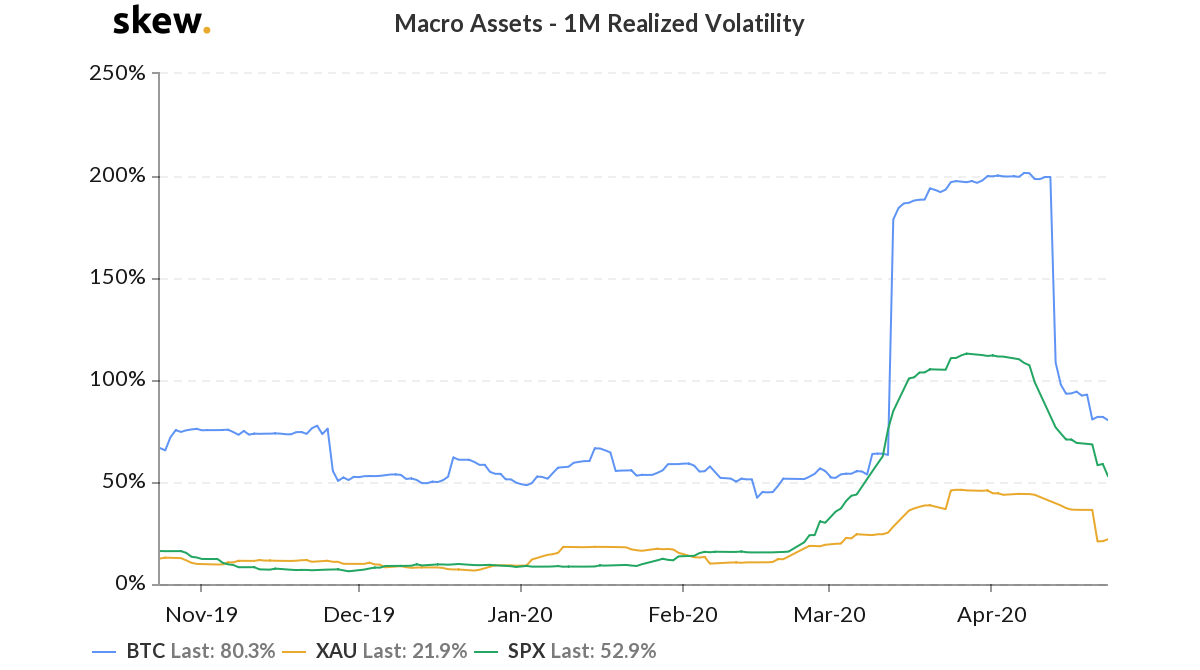
During 1st week of April, the 1-month realized volatility for Bitcoin, Gold, and the S&P 500 were at their peak range this year. In the 2nd week, Bitcoin, Gold, and S&P 500 exhibited volatility levels of 200.2%, 44.5%, and 111.5% respectively. The market was in complete disarray at that time and since then the volatility levels have ironically been identical for all the asset classes. On 23rd April, Bitcoin indicated 80.3%, Gold exhibited 21.9% and S&P 500 indicated 52.9% volatility. All of them, incurring more than 50 percent drop.
However, the juxtaposition gets interesting when Bitcoin is compared to both the assets separately.
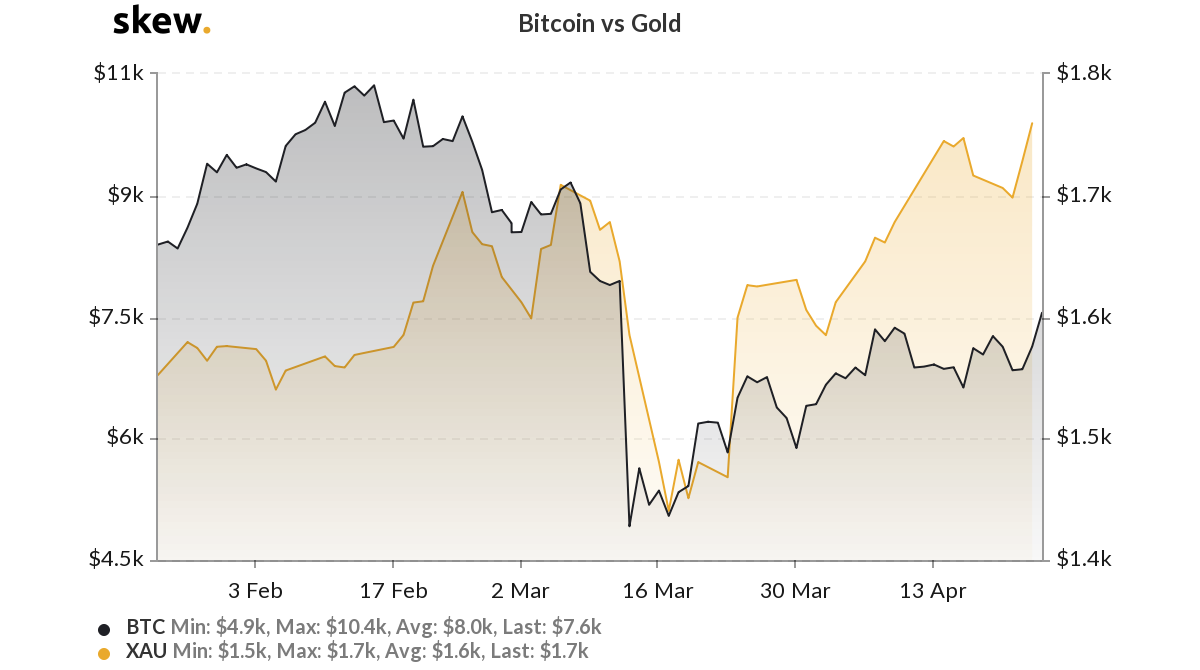
Bitcoin vs Gold
Source: Skew
On observing the price movement between Bitcoin and Gold from April 20th to 21st, the behavioral pattern is pretty normal. Bitcoin dropped from $7.1k to $6.8k on 21st, whereas Gold’s position remained constant at $1.7k. However, the correlation chart between the assets painted a completely different picture.
Source: Skew
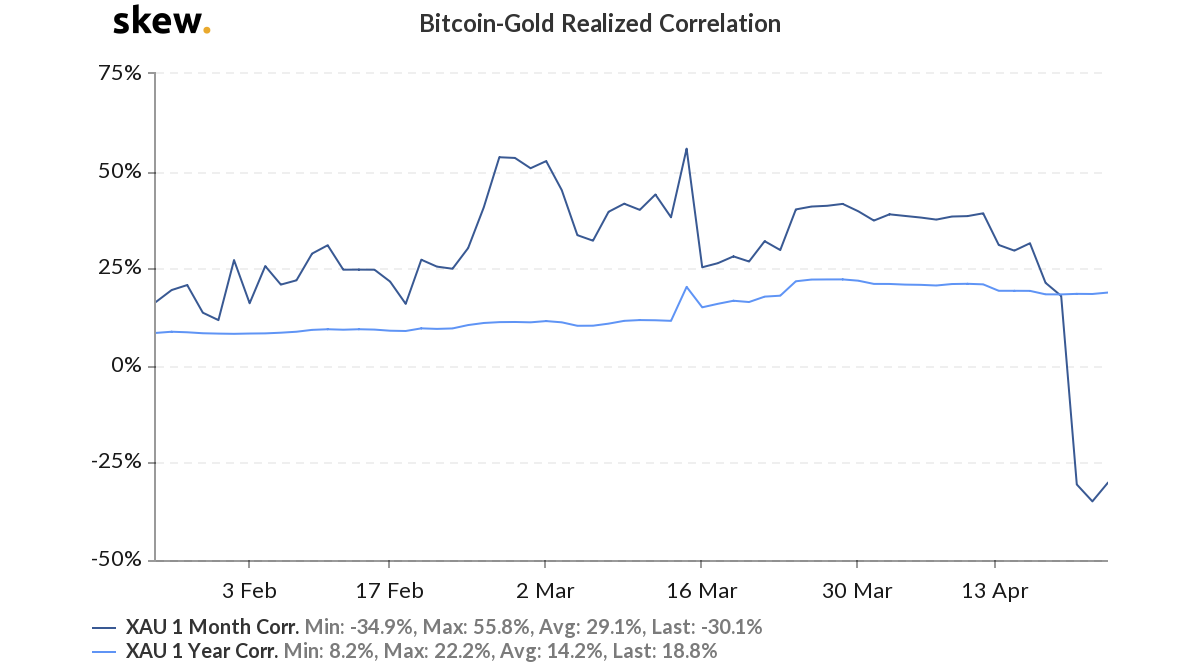
The realized correlation between Gold and Bitcoin was positive on 20th April, when it exhibited an index of 17.9%. However, within 24-hours, the correlation dropped down to -30.6% in the charts, highlighting a significant change. As mentioned above, the price did not exhibit such a drastic shift between Bitcoin and Gold. As press time, the correlation is still negative at -30.1%.
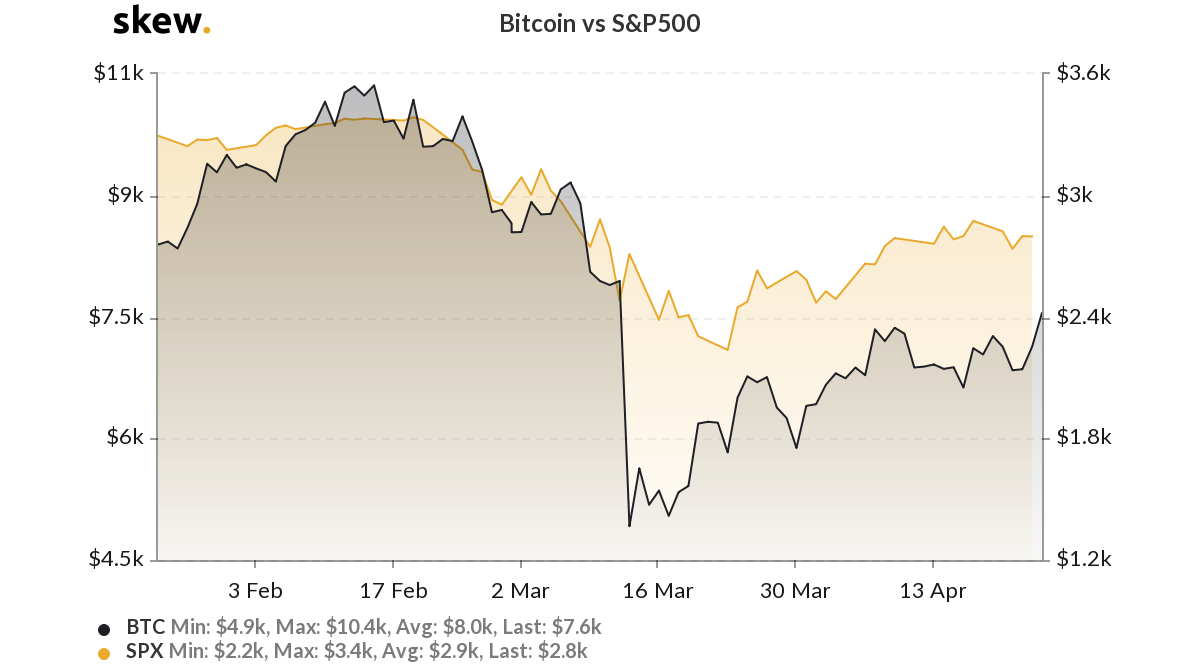
Bitcoin vs S&P 500
Source: Skew
The price chart between Bitcoin and S&P 500 was exactly similar to BTC vs Gold, as on from 20th to 21st April, there was little to no change. Bitcoin dipped from $7.1k to $6.8k and S&P 500 dipped from $2.8k to $2.7k.
Source: Skew
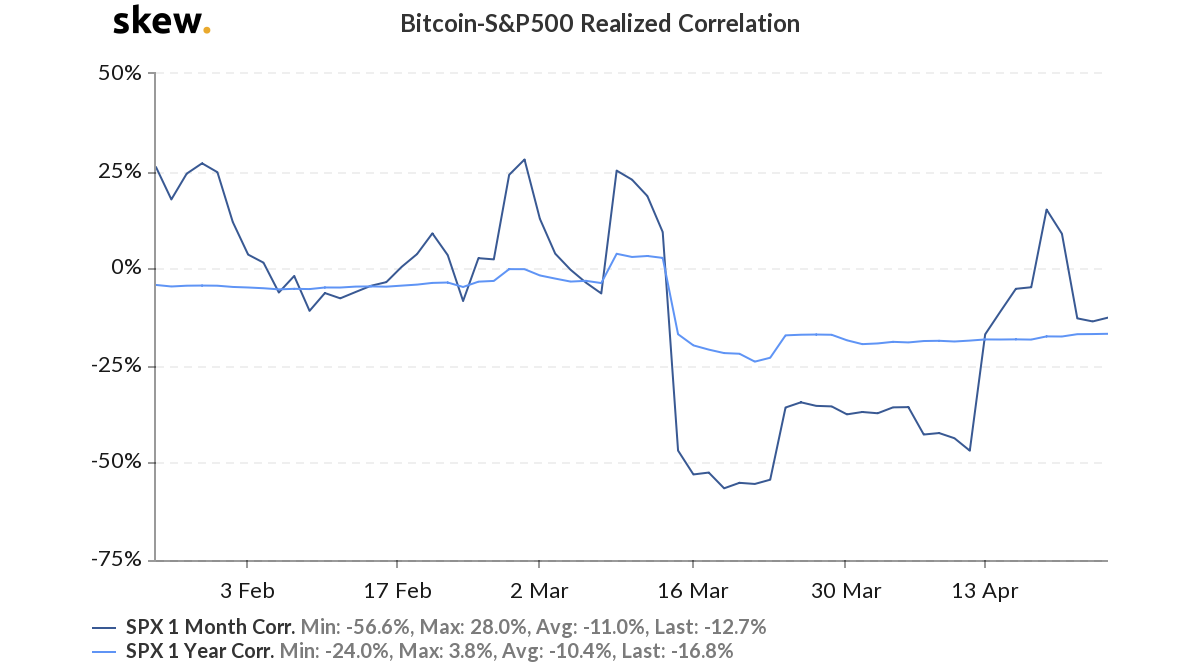
The catch is again in the BTC-S&P 500 realized correlation chart, where from 20th to 21st, the correlation between the assets dropped down from 8.9% to -12.8%, and again, it was without any particular change in their price charts.
Is Bitcoin becoming independent of both Gold and Equities?
The fact that can be inferred and speculated on from the above data is that Bitcoin could be acting as an independent asset without the dependence on any of these large market cap asset class. An argument can also be made that Gold and Stocks have now become co-related to each other amidst the current financial meltdown and Bitcoin could be slowly side-stepping out of the picture.
Source: Skew
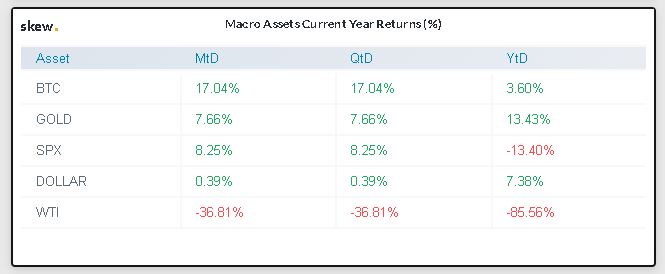
If the macro-returns for Bitcoin are observed, it is 3.60% for the year. For gold and S&P 500, it is plus 13.43% for Gold, whereas it is an identical drop for SP&500 at 13.40%. Keeping these data sets in mind, it appears imperative to analyze Gold’s and S&P 500’s movements for the next few weeks.
At the time of writing, Bitcoin was priced at $7511, with a 24-hour volume of $17.6B
Source From : Ambcrypto