Bitcoin was trading at $10,398 at press time with a total market cap of over $187 billion.
1-Hour Price Chart
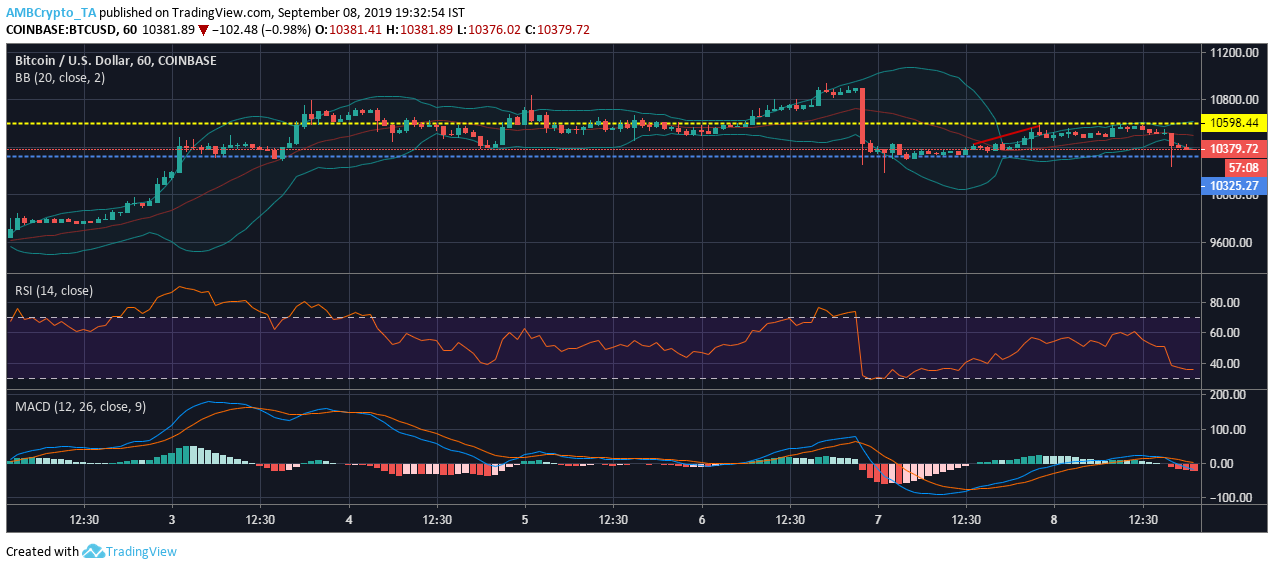
In the 1-hour price chart, Bitcoin is exhibiting an upward trend from $10,424 to $10,580 with the immediate support forming at $10,325.27. Bitcoin needs to break through the resistance point of $10,598.44 to rise higher.
The Bollinger Band indicator showed the price volatility was quite high on 7th September, however, the volatility fluctuation in prices decreased drastically on 8th September.
The RSI indicator suggested that Bitcoin was oversold on 6th September while people overbought Bitcoin on 7th September due to a sudden price rise and again it is being oversold.
The MACD indicator showed bearish sentiment starting on 6th September, and bears dominated throughout 7th September.
1-Day Price Chart
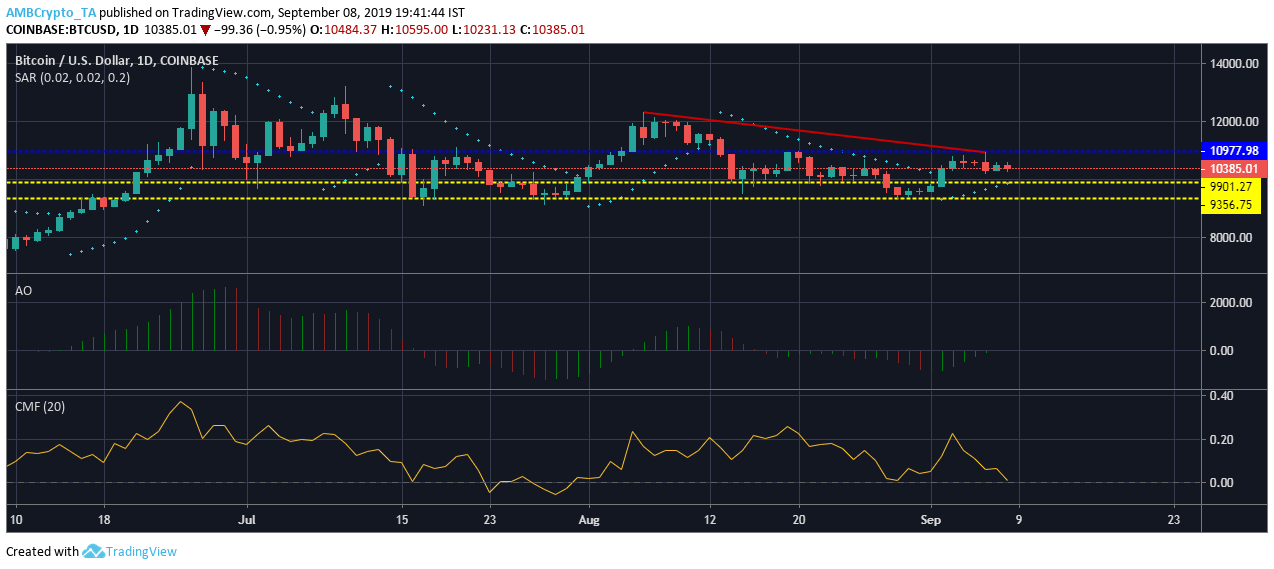
Looking at the one-day price chart, Bitcoin is forming immediate support at $9901.27, and if Bitcoin falls below that the next support will be forming at $9356.75. The resistance that Bitcoin needs to break through stands at $10,977. On the one-day price-chart Bitcoin is showing a downward trend from $12,320 to $10,939.
The Parabolic SAR Indicator showed that the markers are below the candle from 2nd September indicating bearish sentiments are high.
The Awesome Oscillator indicated that the market is fluctuating in the long term with minimal momentum, however, in the short term, it’s more on the bullish side.
The Chaikin Money Flow or CMF showed that the selling pressure is between 23 to 29 august was high while the money flow is neutral since then.
Conclusion
Bitcoin is looking stable at the moment with its prices hovering below the $11k mark and above $10,400 and people are buying it more than selling it.
Source From : Ambcrypto