The cryptocurrency market has welcomed the new year with new normalcy in market momentum. Most of the major cryptocurrencies are seen to be moving sideways apart from a few major changes in the standing of coins. As Ethereum flourishes, the largest cryptocurrency, Bitcoin [BTC] has been facing a gradual fall.
At the time of press, BTC was valued at $3,845.64, with a market cap of $67 billion. The coin registered a 24-hour trade volume of $4.4 billion, with a fall of 1.47% over the past day. The coin shows an overall growth of 4.98% over the past week with a minimal fall of 0.05% recorded in the past hour.
1-hour
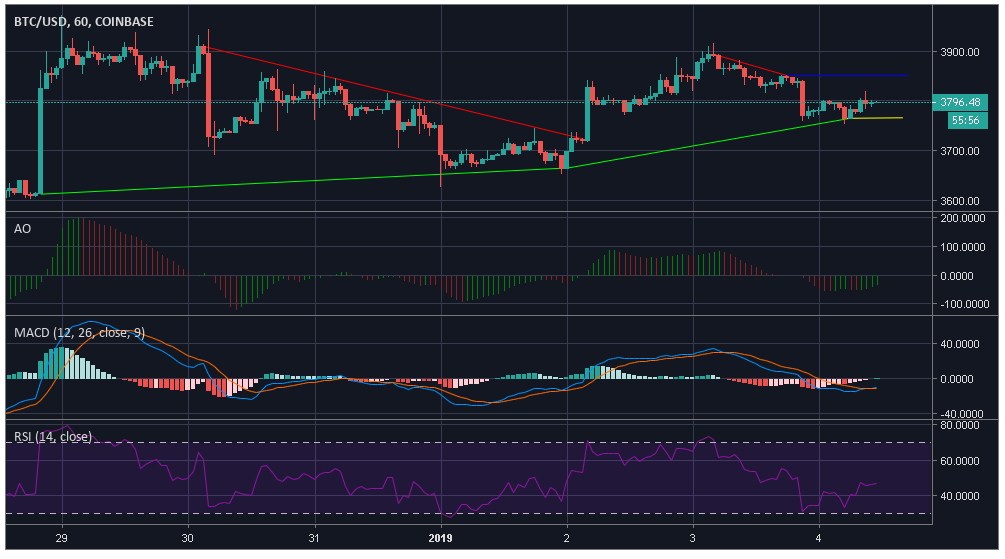
Source: Trading View
According to the one-hour chart of the coin, an uptrend was noted $3,612.13 to $3,664.31, which continued till $3,765. This uptrend saw a downward slope in the middle from $3,909.83 to $3,724, which extended till $3,851. The coin registered resistance at $3,851 and a support was noted at $3,766.06.
Awesome Oscillator marks a bullish trend losing the momentum.
MACD line is under the signal line, pointing towards the awakening of the bear.
Relative Strength Index indicates that the buying and selling pressures are evening each other out.
1-day
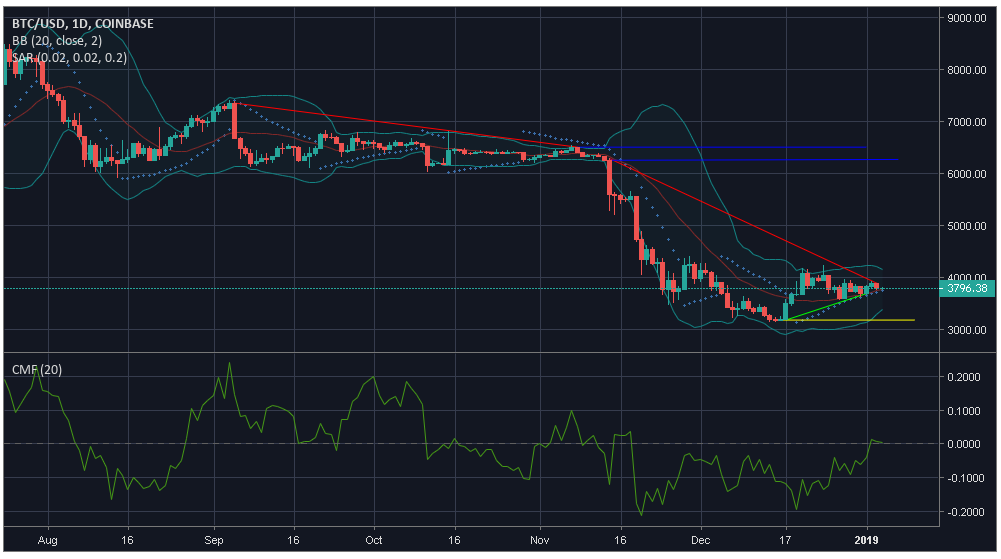
Source: Trading View
The one-day chart of the coin reports a massive downtrend in the value of the coin from $7,359.99 to $6,511.88 after which it fell further from $6,293.38 to $3,890.80. The coin registered only a miniscual rise from $3,184.28 to $3,691.87. The coin noted an immediate resistance at $6,275.01, whereas significant resistance was noted at $6,511.88. The coin was offered strong support at $3,183.01.
Bollinger Bands appear to be converging indicating reduced volatility in the market. The moving average line is under the candlesticks marking a bullish reign in the market.
Parabolic SAR points towards a bearish market as the markers align under the candlesticks.
Chaikin Money Flow also points towards a bullish trend in the market as the marker is above zero. However, the marker might drop anytime under zero making it a bearish market.
Conclusion
As per the indicators, Awesome Oscillator, Chaikin Money Flow, and Bollinger Bands mark a bullish market, whereas the other indicators, MACD and Parabolic SAR mark a bearish market. At the moment, the coin is riding the bull but might fall.
Source From : Ambcrypto