With Bitcoin beginning to move out of the woes of its price plummet seen over a month ago, some key market metrics, despite registering recovery, are showing signs of slippage. The 45 percent price breakdown realigned several aspects of the cryptocurrency market, particularly on the derivatives front.
Following the 12 March sell-off, the Bitcoin Futures leaderboard was reshuffled, pushing an unlikely Binance to the top spot and pushing BitMEX, the spearhead of the crypto-derivatives market, to the fourth spot. Now, as the plummet has had more than enough time to be ‘priced-in,’ intricate shifts are taking place, even for big exchanges.
According to data from Skew markets, the liquidity, even for the exchanges at the top of the charts, is decreasing. Take Binance for example, the exchange post the sell-off saw its $10 million B/O spread measured as a daily average rise as high as 4.66 percent; a day earlier it was 0.86 percent.
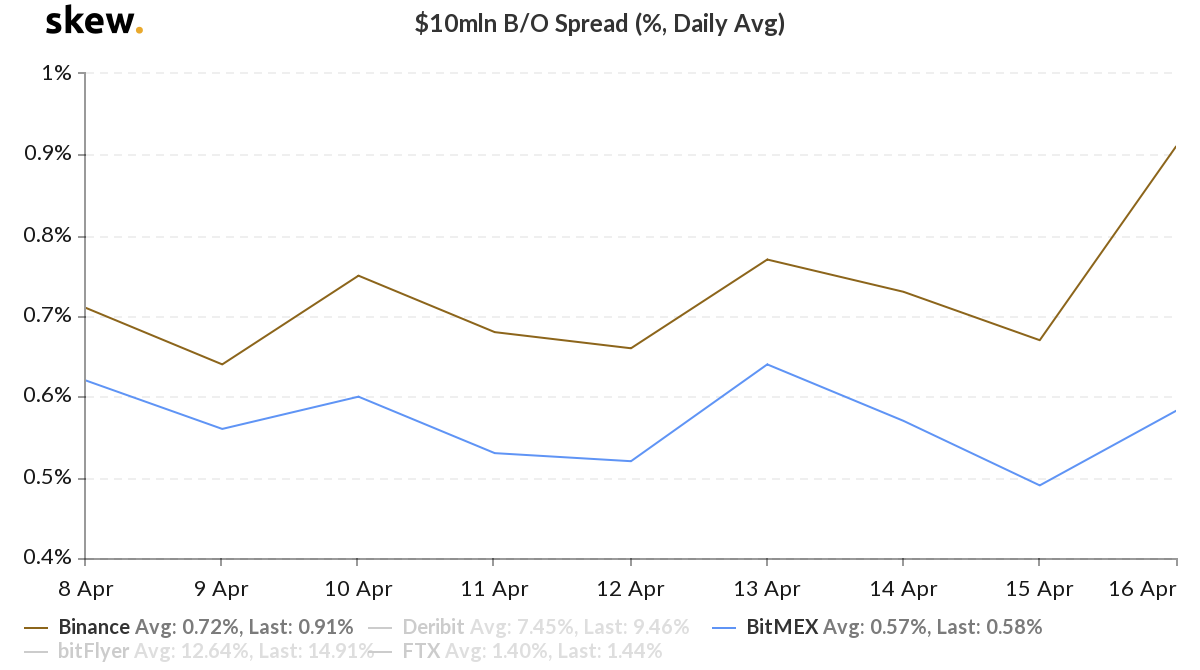
Bitcoin Futures $10 million B/O spread [daily average] on BitMEX and Binance | Source: skew
The rise owing to the rush to either close out long positions or open up short ones resulted in traders widening the spread. However, since then, the spread has fallen as normalcy returned to the
Bitcoin markets, with only brief and short-lived spurts in price.
From 13 March to 15 April, Binance’s spread, across the same price and time range, fell from 4.66 percent to 0.66 percent as its 24-hour volume shot over its competitors. The consistent rise, however, was scuttled on 16 April as the B/O spread rose for the first time since the drop from 0.66 percent to 0.85 percent.
Binance, despite attracting more volume than BitMEX, was not an anomaly. The Seychelles-based exchange also saw its B/O spread increase from 0.49 percent to 0.56 percent, with its daily volume still below $2 billion.
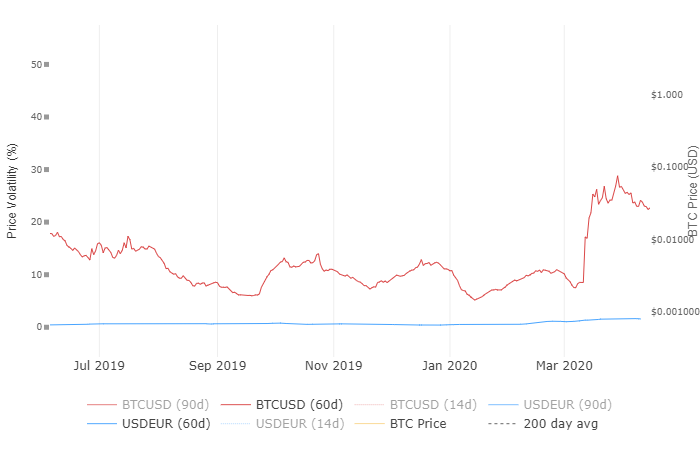
Bitcoin 60-day volatility index | Source: WooBull
Given that Bitcoin has been trading between $6,500 and $7,000 over the past few days and the fact that it’s been over a month since the March plummet, the 1-month realized volatility charts have accounted for the change and implied volatility across the board is low, owing to the incidence of the halving in May and the low volatility term structure based on Bitcoin Options. In light of all these, the widening spread bears introspection.
This fall in immediate volatility i.e. in the past few days, historic volatility i.e. in the past month, and implied volatility i.e. based on Options contracts, shows traders trading with differentiated strike prices even on Binance, an exchange which accrues more than $2 billion in trading volume each day.
Volume-wise, exchanges might be doing well, but not so on the liquidity front.
Source From : Ambcrypto