The first half of 2021 finally concluded after a whirlwind of a rally, one leading to an equally painful correction. Bitcoin touched a new ATH level, but similar to 2017, it was unable to hold its fort at the top for a longer period of time.
More institutional accumulation was seen, but it was balanced with the emergence of the first Death Cross since March 2020. The first half of 2021 had it all, and now it is essential to understand and estimate what’s in store during the 2nd phase.
Bullish 2021: But, how much is reality?
After Bitcoin dropped under $30,000 in June, mainstream media outlets were quick to suggest that BTC has lost all its gains acquired in 2021. Statistically, it was correct, but the fixation was extreme and almost disregarded its previous cycle. The bearish correction was all that mattered, not the fact that Bitcoin had touched a new all-time high less than a couple of months back.
When the first half of 2021 is analyzed for Bitcoin, it can be observed that the digital asset registered gains of 21.16% between 1 January and 30 June. Now, the returns seem rather underwhelming considering BTC registered a strong bullish phase. The actual growth can only be witnessed once the cycle is analyzed from the beginning of its initial charge. October 2020 marked the start of BTC’s bullish cycle, with the chart on the right illustrating Bitcoin’s 445% growth till 19 May.
In comparison, Bitcoin only dropped by 42%, a figure that does not seem significantly bad when considering the growth seen during the entire cycle.
Therefore, it is unfair to analyze BTC’s bullish credentials based on the performance of the last 6 months in 2021. The data is subjective and on-chain fundamentals currently present the best direction for the 2nd half. Overall, BTC’s bullish structure has remained stable.
Bitcoin MVRV and SOPR market re-set, time to accumulate?
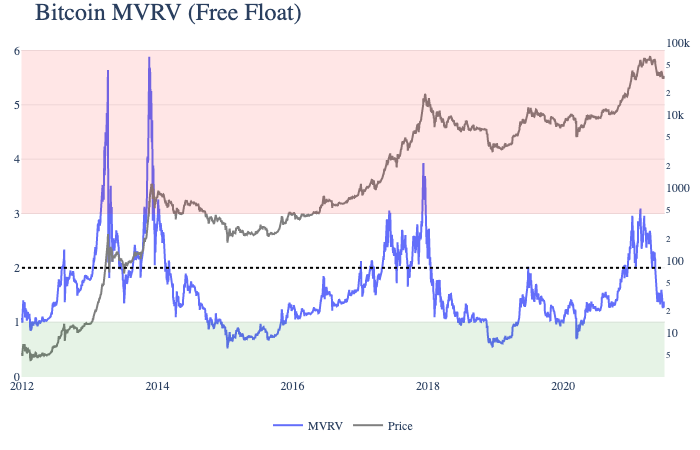
Bitcoin MVRV has been one of the top indicators to identify an accumulation range for Bitcoin. MVRV is calculated by dividing BTC’s market capitalization by realized capitalization.
Source: Coinmetrics
Historically, every time the MVRV has touched a value of 1 or below, it has proven to be a crucial reversal zone. Bitcoin, at press time, was at 1.35, according to data, underlining the possibility that a market appreciation could be on the cards over the coming weeks.
The Spent-Output Profit Ratio, a metric that indicates whether a buy is selling at a profit or loss, also remained under 1 – A sign that sellers have been capitulating. Such an event has not lasted long during the previous two bearish periods.
Source: Coinmetrics
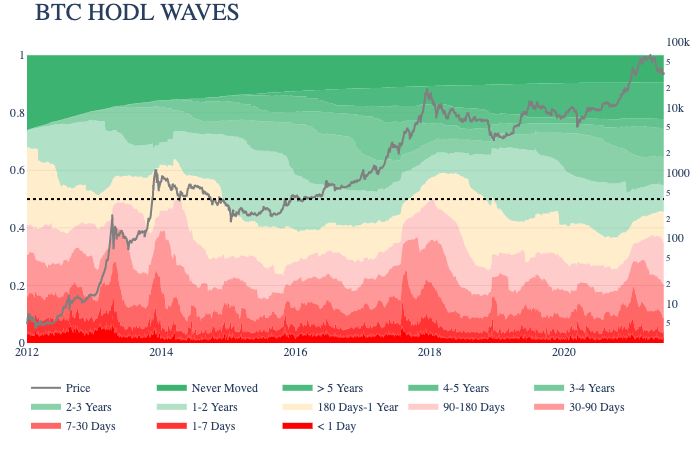
Finally, Bitcoin HODL Waves indicated that long-term holders during the present rally have had a stronger grip on the market than back in 2017. Back in 2017, the market peaked when long-term held supply reached a 60% accumulation rate, but during the last cycle, only 38% of the BTC supply was held for 180 days or less.
Inference can be drawn that the present rally is retail-driven and the potential peak is yet to reach in terms of value.
Are we in a recovery mood already?
Not quite. On-chain fundamentals take time to manifest on price action and Bitcoin continues to trade through relatively choppy trading sessions. However, selling pressure is beginning to subside and with a new quarter on the cards, the road to recovery might begin in the coming weeks for Bitcoin barring any external disruptive event interrupting its market structure.